Image credit: Shutterstock
Key Takeaways
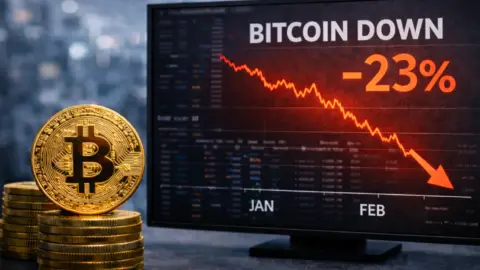
- Bitcoin is down about 23% so far in 2026, the worst start on record
- January closed lower and February is still down, setting up a rare two month slide
- Selling spiked in early February, briefly pushing Bitcoin into the mid $60,000s
Bitcoin is down about 23% through the first 50 days of 2026, its weakest start to a year in the records tracked so far.
The decline follows a red January and a February that remains lower so far. If February finishes down, Bitcoin would post its first back-to-back declines in January and February.
Worst start to the year stands out across prior cycles
A 23% drop by day 50 puts 2026 at the bottom of early-year performance when stacked against prior years.
The drawdown comes after Bitcoin traded materially higher in early January, then sold off through the rest of the month and into February. The scale of the move has reset positioning across spot and derivatives markets.
Back-to-back losses in January and February would be a first
January closed down around 10%. February is down again so far, leaving Bitcoin on course for two straight losing months to open the year.
Monthly return history shows Bitcoin has not previously finished both January and February in the red. In several years, where January dropped sharply, February still managed to close higher.
Early-February selloff deepened as risk markets weakened
Selling accelerated in early February as global risk markets weakened. Bitcoin fell through the $70,000 level and briefly traded in the mid-$60,000s during the sharpest leg down.
The move was accompanied by heavy deleveraging across crypto derivatives venues. As leverage was forced out, volatility rose and intraday swings widened. Bitcoin later rebounded back above $70,000, but the recovery has not been enough to reverse the year-to-date loss.
Checkonchain metric flags a steeper-than-usual early-year drop
A drawdown gauge tracked by Checkonchain has Bitcoin at 0.77 on day 50. Typical down years average 0.84 at the same point in the calendar.
The gap signals the current decline is running deeper than the early-year pullbacks usually seen in weaker cycles. Traders often use these benchmarks to compare the size of drawdowns across different years.
What the market is watching into month-end
February’s close now carries extra weight because it would confirm a two-month losing stretch to start the year.
Market participants are watching whether volatility cools and whether spot demand returns on dips. They are also tracking Bitcoin’s ability to hold above recent lows after the early-February break lower triggered rapid forced selling.