¿Por qué debería invertir en Bitcoin?
Décima parte de los fundamentos de Bitcoin: El fenómeno explicado en lenguaje sencillo.

“Soy nuevo en cripto, veo estos gráficos de trading con líneas y leo/escucho todas estas palabras de moda, pero no tengo idea de lo que significan y/o dónde comenzar”.
Lo primero que debe saber al comenzar a aprender cómo hacer trading con criptomonedas es cómo identificar monedas individuales y los diferentes mercados en los que puede hacer trading. Sitios web como Tradingview.com e Investing.com son excelentes lugares para comenzar, y ofrecen gráficos gratuitos de criptomonedas para que pueda analizar y familiarizarse con ellos.
Cada criptomoneda tiene su propio ‘ticker’ o símbolo abreviado que se utiliza para identificarlo cuando se hace trading en un intercambio o visualiza un gráfico de trading. Bitcoin tiene el ticker ‘BTC’, Ethereum tiene el ticker ‘ETC’, Litecoin tiene el ticker ‘LTC’ y así sucesivamente. Puede encontrar el ticker de una criptomoneda simplemente buscándola en Coinmarketcap.com o en cualquier otro sitio web de listado de monedas. El ticker de una criptomoneda no cambia, es el mismo en todos los intercambios y no puede modificarse.
Al hacer trading en un intercambio o analizar el gráfico de una criptomoneda, está limitado a fiat y criptomonedas específicas con las que se puede hacer trading con otro activo digital. Un “mercado” se refiere a estas monedas fundamentales.
Bitcoin, Ethereum y USDT (Tether) son los 3 principales mercados de criptomonedas que encontrará en los intercambios de activos digitales. Para aquellos de ustedes que no están familiarizados con Tether, es esencialmente una versión de moneda virtual del dólar estadounidense que puede negociarse como fiat digital, donde cada token USDT está vinculado a 1 USD real para estabilizar su precio contra la volatilidad del mercado de cripto.
Esto significa que, si planea comprar/vender o investigar una moneda en particular, necesitará determinar en qué par de trading o ‘mercado’ le gustaría hacerlo. Por ejemplo, si está interesado en comprar Stellar Lumens (XLM) y ya posee Ethereum, deberá hacer trading en el mercado XLM/ETH. Lo mismo ocurre si está interesado en analizar el precio de Stellar Lumen contra Ethereum en una tabla de trading.
Cuando haga trading en un intercambio de cripto en particular, la gran mayoría de las plataformas tienden a admitir exclusivamente pares de intercambio de cripto a cripto. Sin embargo, hay algunos intercambios que permiten pares de trading de divisas fiduciarias, pero estos se limitan exclusivamente a las principales monedas circulantes: Dólar estadounidense (USD), Yen japonés (JPY), Libra de Gran Bretaña (GBP), Won coreano (KRW) y Yuan chino (CNY).Al analizar o hacer trading contra un emparejamiento de moneda fiduciaria, use cada ticker que se muestra arriba, exactamente de la misma manera en que lo haría contra una criptomoneda.
Entonces, ahora que comprende cómo identificar y buscar activos cripto particulares en cada mercado, el siguiente paso es comprender los fundamentos básicos de una tabla de trading y lo que significan todos los datos.
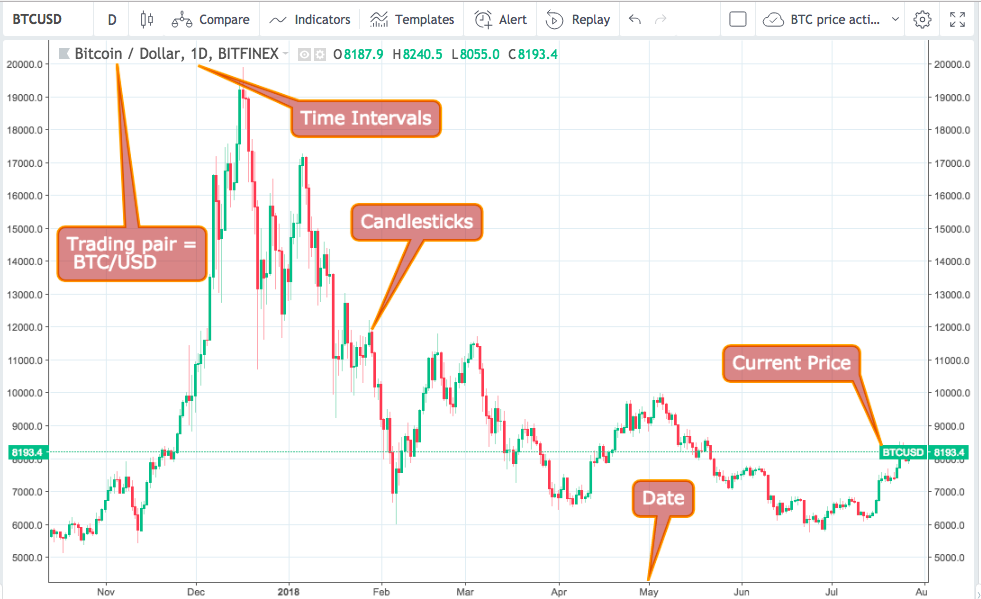
Arriba hay una imagen de cómo se ve un gráfico típico de trading de cripto. En primer lugar, puede ver por los tickers en la esquina superior izquierda que este es un gráfico de Trading de Bitcoin frente al dólar estadounidense.
En la parte inferior de la tabla tiene la fecha, en los lados tiene el precio (que en este caso es en dólares) y también una línea de precios en tiempo real que le indica a qué precio se está haciendo trading de BTC.
El cuadro en sí está compuesto por ‘candelabros’ o ‘velas’ que generalmente son de color verde y rojo, y se utilizan para representar el ‘precio de la acción’ de un activo. Esto simplemente se refiere a la actividad de precios de un activo o la dirección que toma en el mercado.

Aunque pueden parecer muy confusas, las velas son en realidad una forma realmente simple y efectiva de representar los movimientos del mercado de un activo. Las velas verdes se conocen como velas “alcistas”, es decir, cuando el precio de cierre termina más alto que el precio de apertura. Esto significa que durante un cierto período de tiempo el activo ha aumentado de valor. Las líneas arriba y debajo de una vela se llaman “mechas” y representan los puntos de precio más bajos y más altos que alcanzó el activo durante esa vela en particular.
Las velas rojas se conocen como velas “bajistas”, es decir, cuando el precio de cierre termina más bajo que el precio de apertura. Esto significa que el activo ha caído en valor. En el ejemplo que se muestra arriba, puede ver que la vela roja no tiene mecha encima. Esto ocurre cuando un activo no sube más que su precio de apertura. Lo mismo puede suceder con las mechas a continuación, si el activo no cae en valor por debajo de su precio de cierre/apertura.
Al lado del par de trading tiene el período de tiempo de cada vela. Los períodos de tiempo se pueden ajustar a voluntad a minutos, horas, días, semanas, meses y años.
Al alterar el período de tiempo, aumenta o disminuye el tiempo de trading que representa una vela.
Esta es una herramienta útil que le permite ver gráficos intradía, diarios, semanales o mensuales, según el tipo de trading que le interese.
Por ejemplo, si establece el período de tiempo en velas de 5 minutos, puede observar la acción del precio mucho más de cerca para observar desviaciones repentinas; esto es excelente si está buscando operaciones intradía y desea abrir y cerrar posiciones rápidas. Por lo tanto, las velas diarias son útiles para los inversores a largo plazo que estén interesados en ‘HODLing’ o hace trading de un activo durante un período de tiempo mayor.
Para resumir este punto rápidamente, dependiendo del tipo de trading que esté buscando hacer, determinará qué tipo de intervalo de velas utiliza. Los inversores a corto plazo están mejor usando velas de rango más cercano, en cualquier lugar entre 5 minutos y 2 horas. Los inversores a medio y largo plazo tenderán a utilizar cualquier cosa, desde velas de 4 horas en adelante.
De acuerdo, es posible que hasta ahora haya escuchado algunas palabras de moda en esta guía o durante su propia investigación con las que no esté familiarizado, algunos de los cuales son términos de trading comunes y otros que están exclusivamente relacionados con cripto. A continuación se muestra una lista de los términos más utilizados que sin duda encontrará al hacer trading, analizar e investigar criptomonedas;
HODL: “Espera por la vida querida”(Hold On for Dear Life).Este es un término muy popular en el espacio de cripto adaptado del término “to hold”.La palabra se refiere cómicamente a cuando los inversores en cripto se aferran a su cartera de cripto durante una fuerte caída del mercado.
FUD: “Miedo, incertidumbre, duda” (Fear, Uncertainty, Doubt).Este término se usa cuando los principales medios de comunicación, individuos o grupos difunden rumores/noticias sobre deficiencias del mercado o predicen caídas bajistas cuando puede haber evidencia insuficiente para respaldarlo. A veces, se dice que estos individuos o grupos están “difundiendo FUD” para crear una respuesta negativa en el mercado.
Alt-Coins: Este término significa ‘monedas alternativas’ y puede usarse para hacer referencia a cualquier criptomoneda que se creó después de Bitcoin. Básicamente, cada moneda que no sea Bitcoin es una alt-coin.
Bifurcaciones duras/blandas: Las, generalmente cuando los desarrolladores desean realizar cambios fundamentales en los protocolos subyacentes o cuando una cadena de bloques existente se ha dañado/violado.
Bifurcación dura: Un cambio permanente que crea una cadena de bloques completamente nueva, volviendo obsoleta la cadena anterior.
Bifurcación suave: Estas son divergencias temporales en la cadena de bloques que se utilizan para implementar actualizaciones de red y modificaciones menores. Tanto la ‘vieja cadena’ como la nueva cadena siguen siendo compatibles entre sí.
SegWit: Esto significa ‘Testigo segregado’ (Segregated Witness) y es una actualización de protocolo que reduce el tamaño de los bloques al eliminar la información de la firma. Cuando las cadenas de bloques como Bitcoin y Litecoin se volvieron demasiado ‘pesadas’ en el pasado, ambas emplearon SegWit como un medio para reducir el tamaño de sus bloques para ayudar con la escalabilidad.
DLT: “Tecnología de libro mayor distribuido” (Distributed Ledger Technology). Esto se refiere a la naturaleza descentralizada de la tecnología de cadena de bloques. Cuando alguien se sincroniza con una cadena de bloques como un ‘nodo’, cada uno tiene un registro completo de cada transacción realizada en esa red en particular. Esto significa que el libro mayor se distribuye en todo el mundo y no es propiedad exclusiva de una sola parte u organización. Debido a esto, es prácticamente imposible corromper un libro mayor de cadena de bloques, porque tendría que cambiar cada libro mayor de nodos individualmente.
Descentralizado: Verá este término en todas partes. La descentralización se refiere al concepto de que ninguna entidad, organización o nación puede controlar una criptomoneda debido a DLT. También significa que una red de cadena de bloques no posee ningún punto único de falla porque se distribuye de manera idéntica en todo el mundo a miles de personas (en términos generales).A diferencia de las monedas fiduciarias, la gran mayoría de las criptomonedas tienen suministros finitos que nadie puede manipular ni cambiar, ni siquiera sus propios creadores. Los creadores de criptomonedas tampoco poseen la capacidad de reclamar o congelar monedas una vez que se han lanzado después de una ICO en los intercambios.
ICO: Esto significa “Oferta inicial de monedas” (Initial Coin Offering) como es el equivalente criptográfico de una IPO en el mundo corporativo tradicional. Las ICO son empleadas por startups criptográfica para recaudar capital inicial para comenzar a desarrollar un servicio o producto. Los tokens o monedas se venden a precios mayoristas antes de ser lanzadas a los intercambios. Las ICO han sido analizadas en los últimos tiempos debido a la gran cantidad de ‘estafas de ICO’; que se han creado para estafar dinero de inversores desprevenidos.
Alcista (Bullish) / Bajista (Bearish): Nuestro primer término comercial es quizás el término más utilizado que encontrará. “Bull, Bulls, Bullish” son parte del mismo término que se utiliza para identificar a los ‘compradores de mercado’ e indicar un mercado en movimiento positivo. Si un activo está subiendo de precio, se considera “alcista”. Bajista, por lo tanto, es lo contrario. Un bajista es un vendedor/alguien que actúa contra un comprador del mercado. Los mercados bajistas ocurren cuando los vendedores dominan a los compradores.
Sentimiento del Mercado: Este término se usa para describir el tono de un mercado. Si un activo está ganando bien, diría que existe un ‘Sentimiento alcista/positivo del mercado’ (Bullish). Alternativamente, si un activo tiene un bajo rendimiento, diría que ‘el sentimiento del mercado es bajista’ (Bearish).
Soporte/Resistencia: Al analizar un gráfico de operaciones, comenzará a notar que hay áreas de precios comunes en las que un precio regresa/lucha por superar. Esto es lo que se entiende por soporte y resistencia (respectivamente). Un área de soporte es un punto de precio particular donde un activo ‘descansa’, generalmente después de una caída bajista. Un área de resistencia es un precio que un activo no pasa por encima y, a menudo, es un objetivo para los comerciantes alcistas al comenzar una ‘carrera alcista’.
Tendencia Alcista/Bajista: Una tendencia alcista es simplemente cuando las velas se elevan gradualmente en un gráfico durante un período de tiempo particular, generalmente cuando hay un sentimiento alcista del mercado. Una tendencia bajista es lo opuesto a este movimiento, y generalmente es causada por una disminución en la demanda de un activo.
Reversión: Esto es bastante claro. Una reversión es cuando un activo encuentra soporte después de una tendencia bajista y comienza a viajar hacia arriba. Esto también se puede usar para describir una disminución bajista repentina después de que un activo alcanza un punto de precio máximo.
Como se mencionó anteriormente, la identificación de las líneas de soporte y resistencia es de vital importancia para cada inversor al decidir si desea realizar un trading o no. Encontrar estas líneas le proporcionará una base sólida para analizar un activo con más detalle. Si volvemos a mirar el gráfico BTC/USD a continuación, durante las velas de 1 día, podemos ver líneas de soporte y resistencia muy claras que han jugado un papel importante en la configuración del precio de la acción de Bitcoin durante los últimos meses
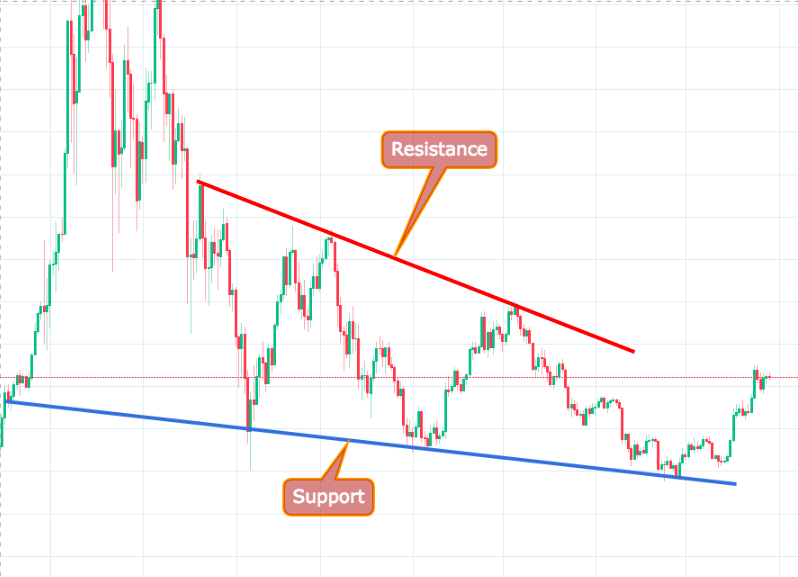
La mejor manera de identificar un área de resistencia es trazando una línea que conecte todos los máximos más altos del precio de la acción. A veces encontrará que una línea no siempre se ajusta perfectamente entre ciertos puntos y puede que tenga que ignorar ciertas velas anómalas, pero aún tendrá una buena idea de dónde es probable que luche el precio de la acción en el futuro. Lo mismo vale para encontrar líneas de soporte; dibuje una línea que conecte tantos puntos bajos como pueda encontrar. Este nivel también se conoce a veces como la ‘base de soporte’ y puede ser un área excelente para abrir una posición si el activo se ha recuperado de la misma área en el pasado. Como puede ver en el cuadro anterior, Bitcoin pudo retroceder de su base de soporte en 3 ocasiones separadas. Eso lo convierte en un fuerte nivel de base de soporte. Sin embargo, vale la pena señalar que las bases de soporte pueden fallar si la oposición bajista vence a los traders alcistas; por lo que no siempre puede confiar solo en buenas líneas de soporte para hacer predicciones precisas del mercado. Lo mismo puede decirse de las áreas de resistencia fuerte también.
También hay ocasiones en las que una resistencia o soporte puede ‘voltearse’ y actuar como lo contrario durante un período determinado. Por lo general, estas líneas cortan a través del precio de la acción y a veces pueden proporcionar pistas de que una tendencia está a punto de revertirse.
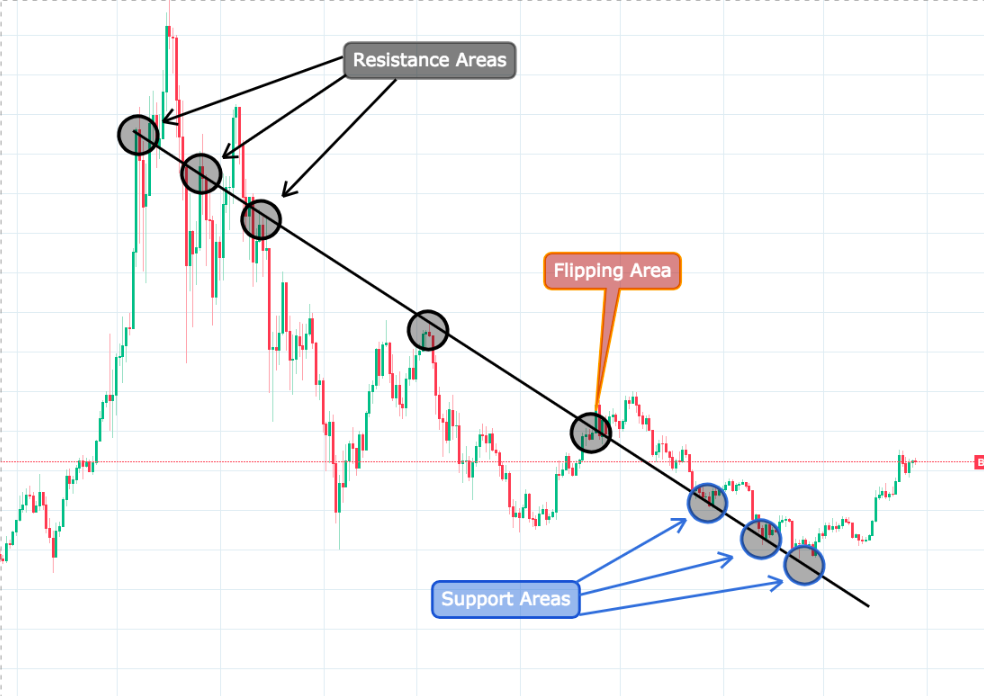
En el mismo gráfico BTC/USD puede ver un ejemplo de este nivel de ‘volteo de resistencia/soporte’. En esta ocasión, Bitcoin rompió el nivel de resistencia a la baja y comenzó a usarlo como un área de soporte; más adelante para impulsar este soporte y comenzar a revertir alcistamente.
Un famoso matemático italiano de renombre llamado Leonardo Fibonacci descubrió una secuencia de números de gran importancia a principios del siglo XIII. La secuencia de números tenía una amplia gama de aplicaciones increíbles en álgebra, geometría y luego se usó para explicar fenómenos naturales como la forma en que se forman las flores y conchas de los caracoles.
Durante el siglo XX, los operadores bursátiles comenzaron a notar que los niveles futuros de soporte y resistencia podían identificarse utilizando un cierto rango de números de la secuencia de Fibonacci; particularmente 0.236 (o 23.6%), 0.382 (38.2%), 0.5 (50%) y el 0.618 (61.8%).
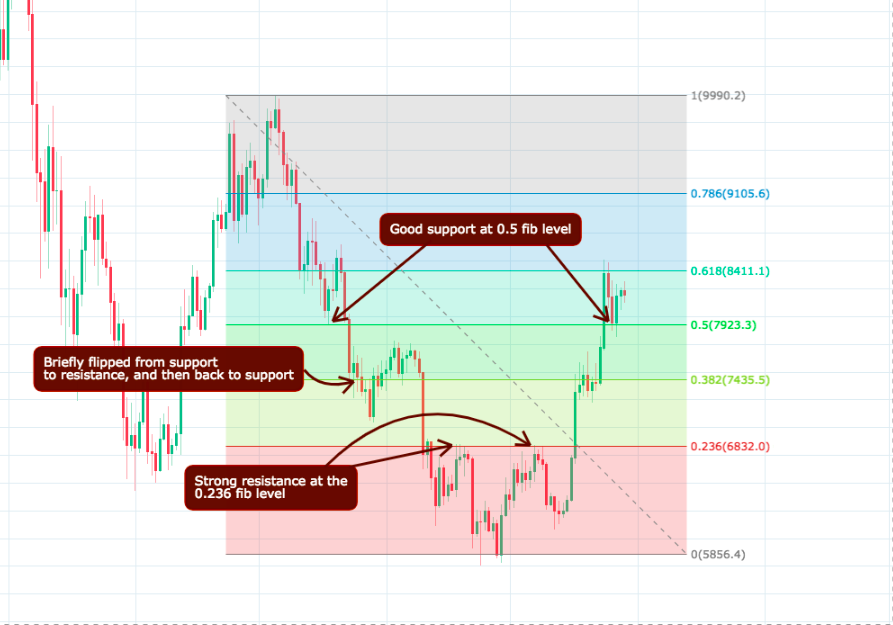
Esta herramienta de trading sigue siendo muy popular, incluso en el mercado de cripto altamente volátil y a menudo impredecible de la actualidad. Puede utilizar esta herramienta de indicador de varias maneras diferentes para predecir todo tipo de patrones diferentes, pero por ahora nos centraremos en su aplicación básica. Cuando use el retroceso de Fibonacci, querrá identificar tanto un punto alto como uno bajo en el gráfico durante un período de tiempo particular que le interese analizar. En el gráfico BTC/USD anterior, se usó el punto más alto desde principios de mayo del 2018 y se midió hasta el punto de precio más bajo en $5.856. Aquí puede ver claramente cómo los niveles proyectados de soporte y resistencia de Fibonacci han jugado un papel importante a lo largo de la recuperación de Bitcoin desde el punto de precio más bajo, y donde es probable que Bitcoin encuentre soporte y una presión de venta bajista en el futuro.
Ahora que comprende las áreas de soporte/resistencia y el retroceso de Fibonacci, es hora de ver 3 de los indicadores más utilizados por los operadores del mercado; MACD, índice de fuerza relativa (RSI) y medias móviles.
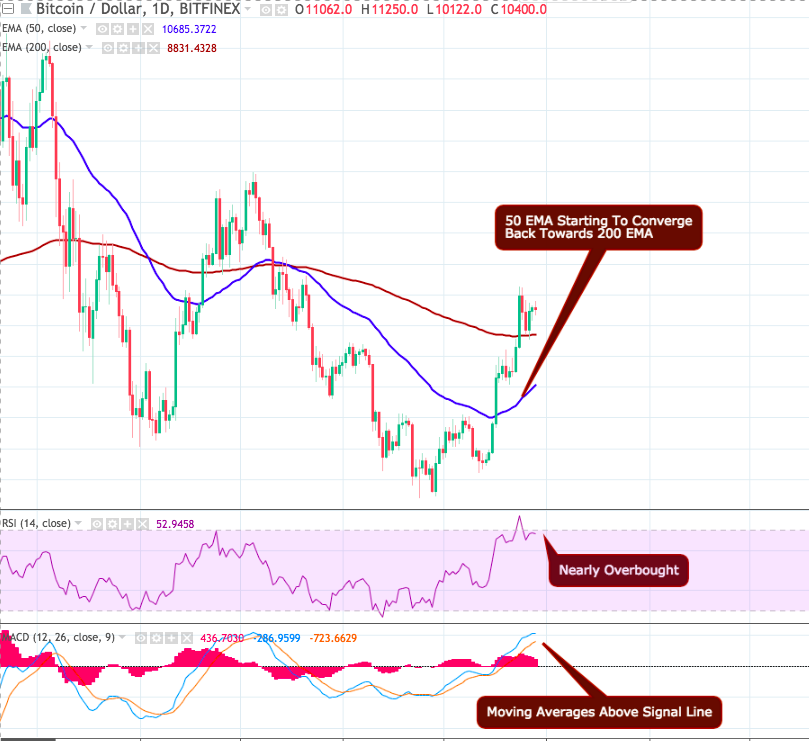
MACD significa ‘Convergencia/divergencia de media móvil’ (Moving Average Convergence/ Divergence). Pertenece a un grupo de indicadores conocidos como indicadores ‘rezagados’, lo que significa que traza datos después de que se ha producido un movimiento particular en el gráfico. Sin embargo, el indicador MACD es el pan con mantequilla de cada trader cuando se trata de medir la fortaleza y la dirección futura de un activo. El MACD consta de dos promedios móviles (MA), el MA ‘más rápido’ y el MA ‘más lento’. El primero sigue el precio de la acción mucho más cerca que el segundo, lo que nos permite extraer inferencias de mercado cuando los dos interactúan. Cuando el MA más rápido converge (o pasa encima) del MA más lento, suponemos que el impulso de compra está ganando detrás de un activo. Cuando el MA más rápido diverge (o pasa debajo) del MA más lento, suponemos que el impulso de venta está ganando detrás de un activo. También hay una línea MA horizontal de 9 días conocida como la ¡línea de señal’ que se utiliza para determinar las señales de compra y venta. Cuando ambos MA pasan por debajo de la línea de señal, asumimos que el impulso general está disminuyendo y asumimos que está aumentando cuando cruza por encima. Esto va acompañado de un histograma que se ubica a lo largo de la línea para representar la fuerza y duración de un movimiento. En el gráfico BTC/USD de arriba, el MACD es el indicador inferior. Aquí puede ver que ambas MA están muy por encima de la línea de señal, con la MA más rápida alejándose de la MA más lenta. Esta es una buena señal de un fuerte momento de compra detrás de BTC en este momento.
El indicador RSI es lo opuesto al MACD, ya que es parte de un grupo conocido como indicadores ‘principales’. Esto significa que utiliza una fórmula particular para predecir los movimientos de precios con anticipación. El RSI es un oscilador que viaja entre cero y 100.Dentro de este rango hay un canal de índice que se ejecuta entre 30 y 70. Cuando el RSI pasa por debajo de 30, asumimos que el activo está ‘sobrevendido’, lo que significa que al activo se le está haciendo trading por debajo de su valor de mercado esperado y debería recuperarse en breve. Cuando el RSI supera los 70, suponemos que el activo está ‘sobrecomprado’; esto significa que el activo se cotiza por encima de su valor de mercado percibido y normalmente se corrige nuevamente en el canal poco después de salir. En el gráfico BTC/USD anterior, puede ver que BTC ya estaba sobrevendido en un movimiento anterior del mercado y está cerca de superar los 70 nuevamente. Entre otras cosas, esto nos dice que la demanda de Bitcoin es alta y que el activo tiene un fuerte impulso de compra.
Hay dos tipos de promedios móviles que la mayoría de los operadores tienden a usar, promedios móviles simples (SMA o simplemente MA) y promedios móviles exponenciales (EMA). La única diferencia entre estos dos es que los EMA otorgan mayor peso a los puntos de precio más recientes, mientras que la SMA aplica el mismo peso a todos los puntos de precio. En el ejemplo anterior, estamos utilizando EMA.
Cualquier promedio móvil se puede ajustar a diferentes longitudes: un valor bajo (5,10,15, etc.) le dará un promedio móvil muy cercano en relación con la acción del precio, mientras que un valor MA más alto (50, 200, 500,1200, etc.) le dará una línea media mucho más amplia. De manera similar a los períodos de tiempo, las longitudes promedio móviles se pueden ajustar para adaptarse a cualquier tipo de trading que le interese hacer/monitorear. Siempre querrá usar al menos 2 promedios móviles juntos para obtener puntos de referencia similares que obtiene en el indicador MACD. Si está buscando bitcoins intradiarios, lo más probable es que vea BTC/USD en velas de 5 minutos a 30 minutos y use dos MA o EMA establecidos en algo así como 25/10.Esto significa que un MA está rastreando un promedio de 10 velas, mientras que el otro está rastreando un promedio de 25. Si el valor más bajo converge por encima del valor más alto MA, puede suponer que el mercado se está moviendo alcista. Alternativamente, si el 25 MA comienza a cruzar el 10 MA, esto le dará una buena indicación de un mercado bajista. Si está buscando el trading de gráficos diarios como el anterior, entonces la mejor combinación para usar es 50/200 MA o EMA. Cuando el 50 MA cruza por encima del 200 MA, se conoce como ‘Golden Crossover’ y es ampliamente considerado como una señal de compra muy fuerte. Si el 200 MA cruza por debajo de 50 MA se conoce como ‘Death Cross’ e indica una fuerte presión de venta de los bajos.
Finalmente, tenemos una selección de patrones básicos que a veces se forman en la acción del precio de un activo, y que tienden a presagiar movimientos alcistas o bajistas del mercado antes de que sucedan.
Vale la pena reiterar en esta etapa que cuando comience a analizar el mercado de cifrado, querrá combinar TODOS estos factores individuales antes de hacer su predicción/movimiento.
Una regla general con todos los patrones es que, si las velas entran en el patrón desde la parte inferior, es probable que continúen hacia arriba (alcista). Si las velas entran en el patrón desde la parte superior, generalmente continúan hacia abajo (bajista)
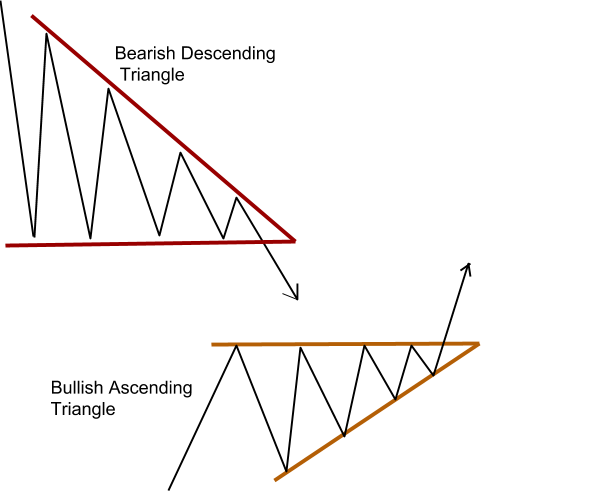
Los patrones de bandera se caracterizan por tener niveles de soporte y resistencia de tendencia descendente / ascendente uniformemente. El precio de la acción a veces puede recorrer un largo camino dentro de estos patrones y puede ser difícil de detectar al principio.

Décima parte de los fundamentos de Bitcoin: El fenómeno explicado en lenguaje sencillo.
Mientras que las ICOs han demostrado ser una vía popular de crowdfunding, numerosas empresas han recurrido a las ICOs inversas - aquí,...
¿Cómo es un sistema de recompensas en la cadena de bloques? En esto, exploramos diferentes tipos de programas de recompensas de ICO.
Si acabas de empezar a investigar el salvaje mundo de las criptodivisas, lo más probable es que no sepas realmente lo que está pasando. A...